

Voronoi Diagrams
Voronoi diagrams are mathematical constructs that provide useful applications in a variety of different disciplines. They were named after 19th century Ukrainian mathematician Georgy Voronoi, however informal use of such diagrams can be traced back to Descartes as early as 1644.
In short, Voronoi diagrams, also known as tessellations, decompositions or partitions, are proximity diagrams that partition a plane into regions based on the distance to points in the specific subset of that plane. Each of these subsets or ‘cells’ are constructed with a given point or ‘seed’ in mind, to determine an area of all points closest to that seed, than any other in the plane. These regions, called Voronoi cells can be seen in Figure 1.
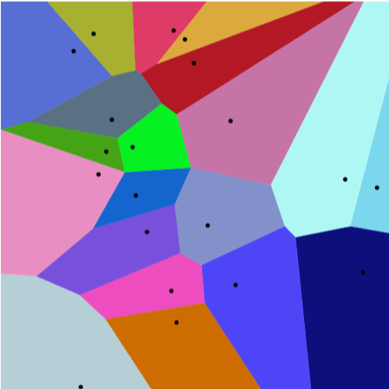
Figure 1: Voronoi Diagram showing 20 points (seeds), and their Voronoi cells
Voronoi Diagrams have been used in a multitude of areas such as environmental studies, cell biology, crystallography, transport planning, and communications theory. One of the first and best-known applications of Voronoi diagrams was by 19th century British physician Dr. John Snow during a serious Cholera outbreak in 1854. During this time, Snow was busy gathering statistics on the number of victims and location of outbreaks. Snow had theorised that cholera was being spread by an agent in contaminated water and not through pollution or “bad air” as previously thought. He attempted to prove his theory by mapping the locations of individual water pumps and then generated cells which represented all the points on his map which were closest to each pump. Using this map, he was able to determine that almost all the fatalities were in houses supplied by a single pump on Broad Street, Soho. Once the handle of the pump was removed, death rates greatly diminished or ceased altogether. An interactive map of this outbreak can be viewed using the GeoGebra file at the link: https://www.geogebra.org/m/deqcfxzp . GeoGebra is a Dynamic Mathematical Software that has various useful applications in many areas of mathematics. GeoGebra Classic 5 can be downloaded directly onto any computer for free and can be accessed at the following site: https://www.geogebra.org/download.
The once popular television series ‘Numb3rs’ also discusses Voronoi maps and their uses in season 2 episode 10, called ‘Bones of Contention’. In the episode, the protagonists try to recreate a Native American settlement-pattern analysis in order to solve a case. They discuss how these diagrams have been used in mathematics and give an example of finding the closest cheeseburger restaurant from any given location.
Voronoi diagrams can be constructed by hand or using computer imaging software. To accurately construct a Voronoi diagram, a map called a Delaunay Triangulation must first be created. These triangulations can be constructed using either circumcircles or linear geometry. For the purposes of the investigations within this module, we will be using the later method, however, you may first need to walk your students through some basic knowledge of coordinate geometry and straight lines. This information can be accessed in the ‘Teacher Notes’ section of this module.
